

David
Developing Kurachan and Data Brain has led us to a practical question: when an AI agent fails to finish a task, what should we change? Our coauthored paper ToolBottleneckBench studies how the model and the system around it contribute to the result. It separates the tools an agent sees, the budget it receives, and the point where it stops.
More tools, more decisions
An agent can search email, read a calendar, or update a customer record by calling tools. It reads a request, chooses an operation, examines the result, and decides what to do next. Each extra tool broadens what it can do, but also adds another option to consider.
Imagine asking an assistant to collect the documents for next week's meeting. It may need both a calendar tool and a file-search tool. If it fails when given a larger menu, did it choose the wrong operation? Or did it run out of room to finish choosing?
A success rate alone cannot tell us. The surrounding system sets limits on each response, the total task budget, and the number of tool calls. The paper calls this system the execution harness. Evaluating an agent means evaluating the model together with these settings.
Change the conditions while keeping the task fixed
The main experiment covers 36 groups of related tasks across 12 business intents, tested with 21 model-and-service configurations. A configuration includes the model, its provider route, and the tool-calling protocol. Within each task group, the goal and important facts stay the same.
Four conditions are varied:
| Condition | Values tested | Question |
|---|---|---|
| Registered tools | 32, 512, or 2,048 | Can retrieval find the tools the task needs? |
| Tools shown to the model | 8, 32, or 128 | Can the model start work with more options? |
| Workflow | At least 2, 4, or 6 read calls | Can it collect the evidence through several steps? |
| Returned data | Four representations of the same facts | Does the format of the information matter? |
Registered tools and visible tools are different. A system can register thousands of tools, retrieve 16 candidates, and show only those candidates to the model. A missing tool at the retrieval stage is a different problem from an available tool that the model never uses. The visible-menu experiment always includes the required operational tools.
The tasks are synthetic business scenarios written in English. Success requires all nine checks to pass, covering the answer, evidence, workflow, allowed changes, and budgets. This makes completion concrete: a plausible answer without the required evidence does not pass.
The main settings allow 1,024 completion tokens per response, 128,000 tokens for the whole task, and two tool calls beyond the shortest required workflow. A token is a unit of text processed or generated by a model. Some providers also count internal reasoning against the per-response limit. A task can therefore have budget left overall while one response has already reached its cap.
Larger menus reduced success
Increasing the visible menu from 8 to 128 tools reduced success by 12.3 percentage points in the main experiment. Results fell in 34 of the 36 task groups. Of the four pressures, the larger visible menu produced the clearest loss.
This comparison gives the model help after its first tool call: the menu is narrowed using information about the correct operational tools. When the full menu stays visible throughout, the gap grows to 17.5 points.
The other changes had smaller or less consistent effects. Increasing the main workflow from two to six read calls produced no clear overall change across configurations. Changing the returned-data format also had a smaller effect. These comparisons helped identify the larger menu as the place to investigate first.
Many runs stopped before using any tool
With 128 tools visible, 411 runs reached the per-response completion limit. 391 of them ended before the first tool call. The agent had not yet reached the point where it could take an action.
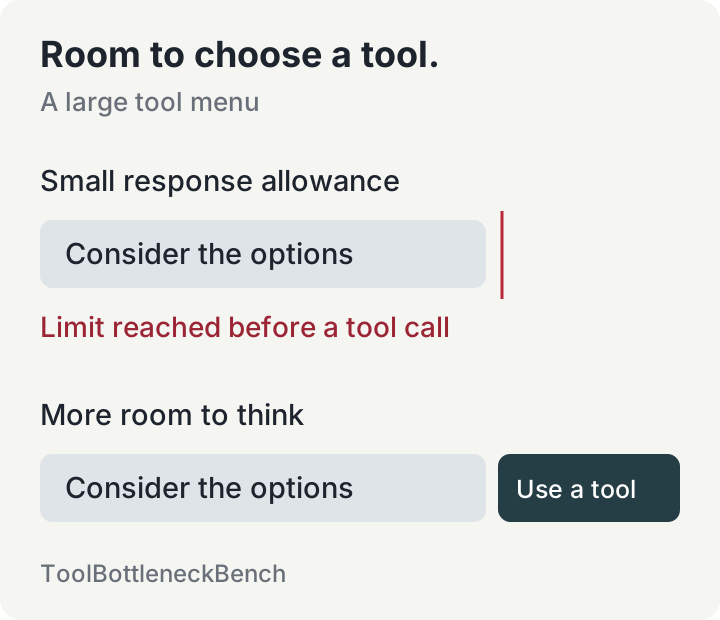
To test the role of that limit, the researchers raised it from 1,024 to 16,384 tokens, while keeping the total task budget and call limit unchanged. They repeated the comparison for the same configurations.
For six configurations that frequently hit the cap, the success gap between 8-tool and 128-tool menus shrank from 43.7 to 2.7 points. At the higher limit, truncation with 128 tools fell to 1.4% or less for all six.
That result identifies a specific bottleneck. These configurations needed more room within a single response to consider the menu and reach an action. Increasing the overall task allowance would address a different limit.
The six configurations are a selected group from the main panel of 21. Their 43.7-point gap and the main experiment's 12.3-point gap describe different groups. The paper also finds menu losses in configurations that rarely hit the cap, making the execution log important for choosing a fix.
Read the event behind a failure label
The evaluator checks its nine requirements in order and records the first one that was not met. A label such as “selection failure” can therefore cover a run that never finished choosing.
All 849 runs labeled as selection failures made zero tool calls. Of those, 838 ended at the response limit. Reading the label as “the model picked the wrong tool” would send an investigation in the wrong direction.
Useful logs should show whether the first call happened, how many operations ran, and what ended the task. These observations separate retrieval, selection, and execution. They also show whether the next experiment should change the tool menu, the budget, or the workflow.
A limit can be reached for different reasons: a menu may take longer to consider, or the model may spend its allowance on unnecessary steps. Recording the termination reason provides a starting point for investigating that path.
Two changes to how the work is organized
The paper also tests ways to change the surrounding system.
Choose the connection before searching for tools. With 2,048 registered tools, choosing a connector first increased the share of cases where the required tools reached the candidate list from 19.4% to 77.8%. This is a retrieval result, measured before final task success. It improves the set of operations the model has available.
Let a program follow a defined sequence. Some tool results contain a link to the next record. A controller can follow these links instead of asking the model to make the same kind of decision at every step.
In a separate experiment requiring 30 calls, covering 24 business intents and 17 configurations, success rose from 0% to 96.6%. The controller made 28.7 of the average 29.9 calls. The improvement came from assigning that execution work to a program.
These changes act at different points. One helps the right tools reach the model; the other handles a sequence after work has started. Both become easier to evaluate once failures are located within the process.
Compare the setup as well as the model
The effect of a larger menu changes with the environment. In an additional ToolSandbox comparison, increased token use was clearer than the change in full-task success. The same pressure can show up as higher cost in one setting and lower completion in another.
ToolBottleneckBench offers a way to investigate those differences: keep the task matched, change a specific condition, and inspect why each run ended. Alongside an agent's success rate, record the tools it saw and the budgets it had. That makes it easier to decide whether the next improvement belongs in the model, retrieval, or execution system.
Paper and code
Zichuan Xu, Yuyang Dong, Makoto Onizuka, Chuan Xiao. ToolBottleneckBench: Measuring Tool-Agent Performance under Controlled Pressures and Fixed Harness Budgets.